
What does a chart digitizer produce?
A chart digitizer converts the visible position of bars, lines, or points into rows of numerical data. DataFromChart exports CSV, TSV, XLSX, or JSON after you review the result.
See the recovered values beside the original chart, correct any point that looks wrong, then export CSV or Excel. Try a completed example before uploading your own.
Completed extraction
Choose a chart to compare its source image and recovered table side by side.
1 · Source chart
Customer satisfaction by vendor
Five categories on a linear 0–100% axis.
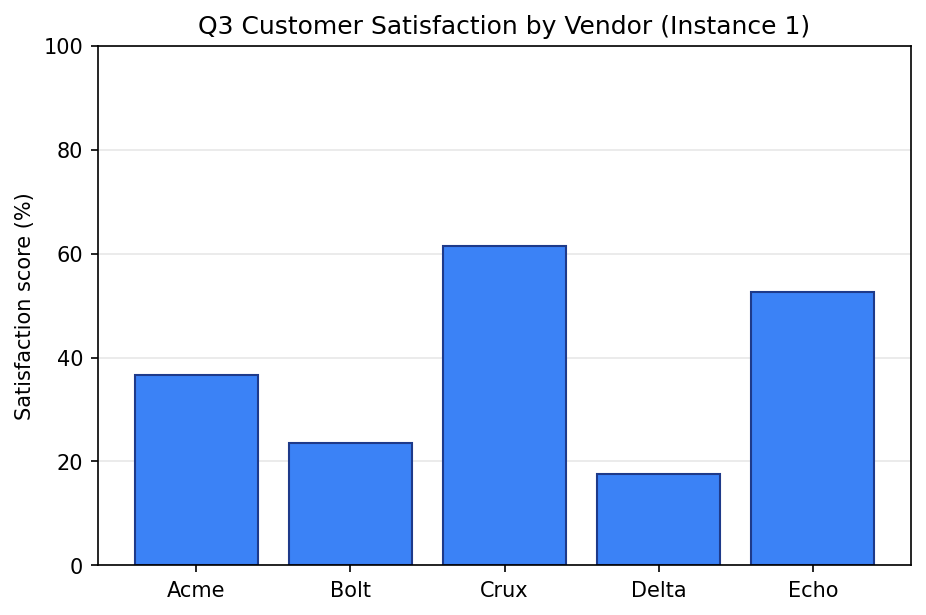
Highlighting Vendor Acme on the source chart
2 · Recovered table
Values reconstructed from the chart
Hover, focus, or tap a row to find it on the source.
| Vendor | Score |
|---|---|
| Acme | 36.6% |
| Bolt | 23.5% |
| Crux | 61.5% |
| Delta | 17.5% |
| Echo | 52.7% |
The extractor shows recovered points on the source chart so you can correct them before export. This completed example opens without signing in.
A digitizer reconstructs visible values; it cannot restore labels or marks that are absent from the source.
DataFromChart is built for line, scatter, area, column, and horizontal bar charts. Pie, radar, Sankey, treemap, heatmap, bubble, and 3D charts are not currently supported.
Dense overlap, compression artefacts, or unreadable ticks can require manual correction or a better source image.
Review every supported chart typeA chart digitizer converts the visible position of bars, lines, or points into rows of numerical data. DataFromChart exports CSV, TSV, XLSX, or JSON after you review the result.
DataFromChart supports line, scatter, area, column, and horizontal bar charts, including grouped and stacked arrangements. It does not currently support pie, radar, Sankey, treemap, heatmap, bubble, or 3D charts.
Yes. Upload a PDF, select the page containing the chart, then crop the relevant plot before extraction.
Yes. AI-assisted and colour-extracted points remain visible on the source chart and can be moved, added, or deleted before export.
Create an account to upload an image or PDF. Manual, colour-based, and optional AI-assisted extraction are available in the same workflow.