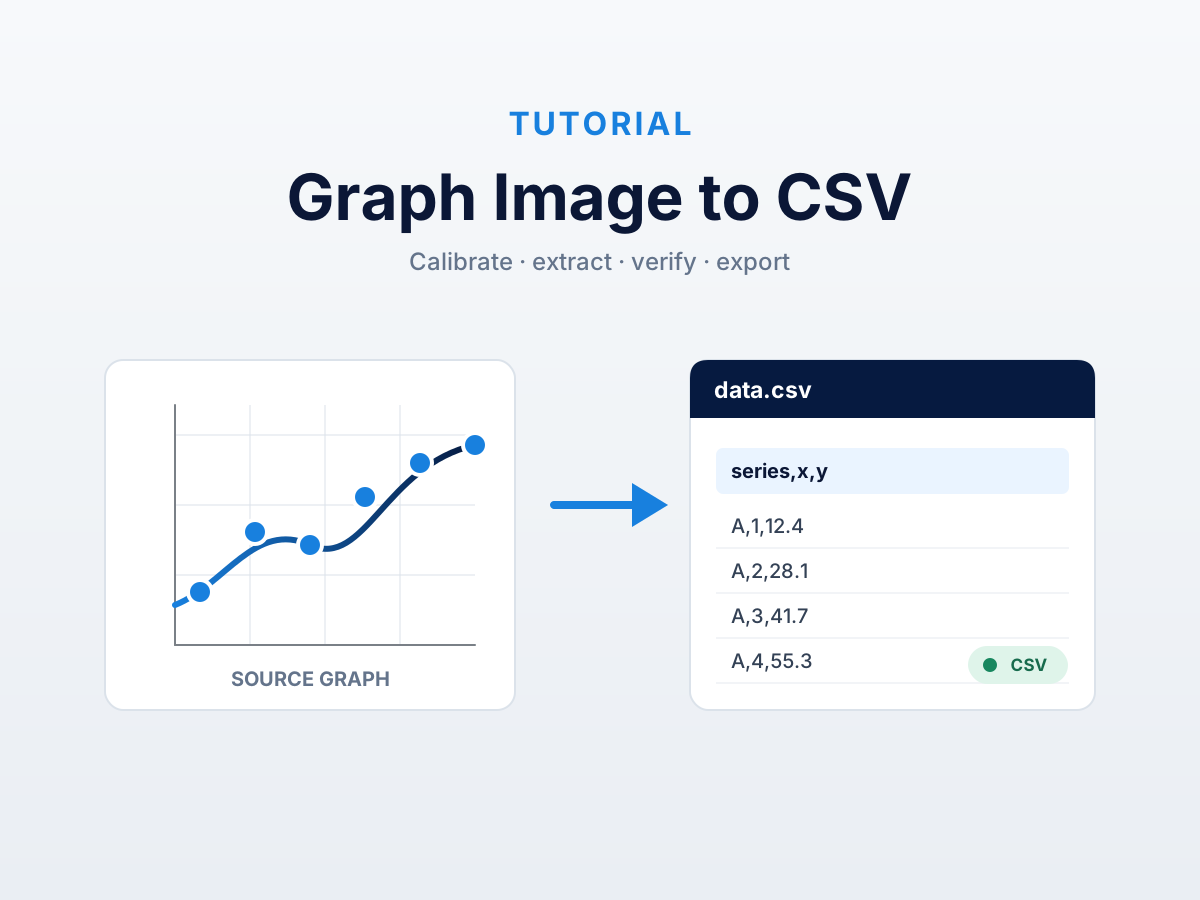
Quintessa’s Graph Grabber and DataFromChart both recover data points from graph images. Graph Grabber is a free Windows desktop application with manual placement and automatic curve detection. DataFromChart is a browser application with manual placement, colour extraction, and optional AI assistance.
This comparison is based on Quintessa’s Graph Grabber 2.0 and 2.0.2 release notes, its published user guide, and DataFromChart’s current product documentation. It corrects a common point of confusion: Quintessa documents Graph Grabber as free software and documents comma-separated text export, not a paid XLSX tier.
At a glance
| Graph Grabber | DataFromChart | |
|---|---|---|
| Pricing | Free software | Manual extraction is free; AI uses credits after three included runs |
| Platform | Windows desktop | Browser application |
| Offline use | Yes, after installation | No |
| Linear and logarithmic axes | Yes | Yes |
| Automatic extraction | Automatic curve detection | Colour extraction and opt-in AI extraction |
| Manual point placement | Yes | Yes |
| Project save | Yes | Yes |
| Documented data export | Comma-separated text | CSV, TSV, XLSX, JSON |
| Other documented output | Re-rendered graph image; MathTrax-compatible data | XLSX can include the source chart image |
What Graph Grabber documents
Quintessa released Graph Grabber 2.0 as a major free update in 2017. Its release notes document automatic curve detection, manual point editing, saved project files, image paste from the clipboard, and locale-aware comma-separated export.
The published user guide describes the underlying calibrated workflow:
- Load, crop, rotate, or zoom the graph image.
- Draw and calibrate the x- and y-axes as linear or logarithmic.
- Add or edit one or more data series.
- Re-render the recovered series or export the raw values.
Quintessa’s 2.0.2 update in 2020 added MathTrax-compatible export and bundled prerequisite software in the installer. The official materials describe Graph Grabber as a Windows tool. They do not document a browser or macOS build.
What DataFromChart adds
DataFromChart keeps the source chart visible through calibration, extraction, correction, and export. It supports manual clicks, colour-based extraction, and opt-in AI assistance. Points from automatic methods can be moved, added, or removed before export.
The browser workflow avoids installing Windows software and accepts PNG, JPEG, SVG, and PDF inputs. Exports include CSV, TSV, JSON, and modern XLSX; XLSX can place the source chart beside the extracted table for review.
Which tool fits which job?
Choose Graph Grabber when:
- you want a free Windows desktop application;
- offline use is required;
- automatic curve detection or manual tracing fits the source graph; or
- comma-separated text and re-rendered graph output meet the downstream need.
Choose DataFromChart when:
- you need a browser workflow on Windows, macOS, Linux, or ChromeOS;
- the source is a PDF or SVG as well as a raster image;
- you need XLSX, TSV, or JSON in addition to CSV; or
- you want colour-based or AI-assisted extraction with editable points.
What this comparison does not establish
The published feature lists do not show that one tool is more accurate or faster. Both depend on readable source images and correct axis calibration. Automatic detection can also require correction when curves overlap, colours are compressed, or labels obscure the plotted series.
For a defensible choice, digitize the same chart with known source values in both tools and compare error, correction time, and export fit. That measures the workflow that matters to you instead of relying on feature-list claims.
Run a like-for-like check. Open the DataFromChart extractor, use a chart with known values, and compare the recovered dataset with Graph Grabber’s comma-separated export.
Sources
- Quintessa’s Graph Grabber 2.0 release notes
- Quintessa’s Graph Grabber 2.0.2 update
- Quintessa Graph Grabber user guide (PDF)
- DataFromChart pricing and included features
- DataFromChart supported chart and file types
See also
Try it on your own chart
Create a free account to upload an image or PDF, calibrate the axes, and export CSV or XLSX. Or start with a built-in sample without signing in.
Open the extractor