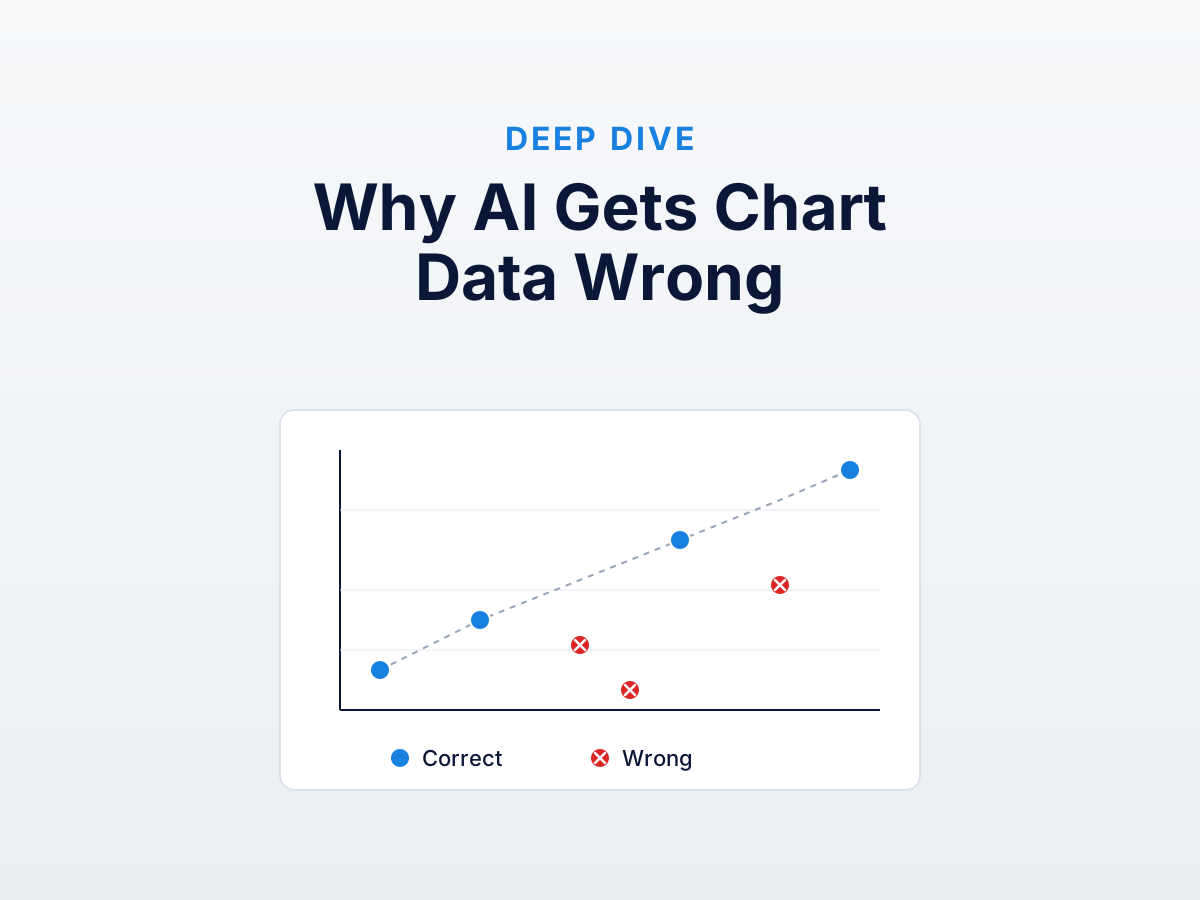
Vision LLMs like GPT-4o, Claude, and Gemini can describe a chart but can’t reliably read its values. Not a prompt-engineering problem — three independent issues (patch-based encoding, round-number bias, axis-as-language) combine to make pixel-precise extraction architecturally hard. In order of how much they matter.
For the empirical version, our testing ran six chart types through ChatGPT and scored the results. This post is the underlying why.
1. Vision encoders patch the image into tiles, and sub-tile precision is lost
Every modern vision-language model encodes images the same way: split into 14×14-pixel patches, turn each into a token, feed those tokens into the same transformer that processes text. The model never sees raw pixels — it sees a downsampled, tokenized summary.
Fine for “what is in this image.” Recognition doesn’t care whether a cat is at (412, 308) or (415, 311). Chart reading is a measurement task, and measurement cares about sub-tile precision. A tick mark is a few pixels. A scatter point is 5–10 pixels. A line crossing is a specific pixel. All smaller than a patch.
The model can compensate by reading axis labels and reasoning about position in tile-units. Works for “20 or 80?” Not for “47.3 or 48.6?” The information is averaged out before the model sees it.
Verify empirically: ask the value of a point at 100% zoom, then zoom out 4× and ask again. The answer changes — same logical position is in a different patch. Computing from patches, not pixels.
The fix would be: an encoder with multi-resolution attention, or one that lets the language model “look closer.” Research models (Cambrian, InternVL) attempt this. No production chat models do it well enough for chart reading. Trend right; timeline unclear.
2. Models are trained to round to “nice” numbers
LLMs are language models first. Trained on text where humans wrote 50 more often than 49.3, round numbers and powers of ten are over-represented. The bias survives instruction tuning and shows up in vision output as a systematic pull toward 5, 10, 25, 50, 100.
Two manifestations:
- Cluster around round values. Returned values for 12 monthly points are disproportionately round versus the true distribution. If truth is 47.3, 52.1, 49.6, the model often returns 50, 50, 50.
- Higher accuracy on round values. Two synthetic charts — one round, one non-round — same model. Round scores better because bias and truth align, not because the model saw it better.
Our testing uses non-round ground truth to force the model to commit to a measurement, not a rounded guess. Accuracy drops substantially when the model can’t cheat with round priors.
The fix would be: training data with more non-round chart-extraction examples, plus a loss function penalizing rounding bias. Doable — chart-to-table datasets (PlotQA, ChartQA, FigureQA) exist — but they’re designed for visual QA, not pixel-precise extraction, and the fine-tuning hasn’t propagated to chat models.
3. Axis interpretation is treated as a language task
The third failure is subtlest and worst. Reading an axis is OCR-plus-reasoning, not measurement. The model identifies tick labels as text, infers the scale from context, then interpolates positions linguistically — reasoning about position in words.
Works for: a bar chart with five labelled bars on a 0-100% axis. Poorly for: anything requiring a coordinate transform.
The pathological case is a log axis. To read a value:
- Recognize log scale (ticks 10, 100, 1000 not 100, 200, 300).
- Read the two nearest tick labels.
- Estimate pixel position between them.
- Convert to log-space (linear interpolation in log space).
- Compute 10 to that power.
Vision LLMs do step 1 fine. Step 2 fine. Sometimes step 3. Almost never 4 and 5 — the arithmetic is conditional on a visual signal from step 3, in one pass with no scratchpad.
On our log-decay chart, ChatGPT returned values matching linear interpolation of visible ticks — ignoring log entirely. The result was well off across most of the y-range. Not “bad at math” — reading the visual correctly but applying the wrong arithmetic.
Polar and log-log inherit this and add more. Polar requires (r, θ) when the encoder is built for Cartesian. We haven’t seen a vision LLM produce usable polar extraction.
The fix would be: chain-of-thought or tool-use prompting where the model writes out the axis arithmetic. It does help — “first state the scale, then the ticks, then compute each value step by step” reduces log-axis error meaningfully. Doesn’t eliminate it, doesn’t generalize to less guided usage.
What this means for you
Every AI chart extraction workflow needs a verification layer because the failures are silent. The model doesn’t tell you when it round-numbered, swapped series, or read log as linear — it produces confident-looking JSON.
Three options, in increasing trust:
- Spot-check 10% of values manually. Cheapest, catches systematic errors, misses one-offs. Fine for low-stakes.
- Re-extract with a different model and diff. Catches more, costs another API call. Disagreements still need a human.
- Re-extract with a calibrated digitizer. Most expensive in human time, catches everything. The only option for audit, peer review, or regulatory filing.
The third is why we built DataFromChart — not because AI is useless for charts, but because the verification step has to exist somewhere, and a tool where you do the calibration is the most honest place to put it. Deterministic math means the only error source is your clicking precision, which is auditable.
What would have to change
For vision LLMs to solve chart extraction at the precision meta-analysts and financial analysts need, all three problems would have to be addressed:
- Multi-resolution vision encoding so the model attends to sub-tile features. Research is moving; production is not.
- Bias-debiased training for numeric extraction, with synthetic data covering log axes, polar axes, dense scatters, and the long tail of weird conventions.
- Built-in tool use for axis arithmetic so the model invokes a calculator instead of doing it in-context.
None are research blockers — each has known approaches. The blocker: chart extraction is a small market for foundation-model labs, and existing benchmarks (ChartQA, PlotQA) measure visual QA, so improvements don’t necessarily translate.
Best guess: “usable for low-stakes chart questions” in 2026, “usable for serious extraction” in 2028 at the earliest, with “serious” almost certainly still meaning “with a verification step.” A workflow without some calibration check isn’t on the roadmap.
Further reading
- AI chart extraction vs calibrated digitization — the decision framework.
- Specialized chart-understanding models — what ChartOCR, DePlot, and PlotQA do that chat models don’t.
Try it on your own chart
Create a free account to upload an image or PDF, calibrate the axes, and export CSV or XLSX. Or start with a built-in sample without signing in.
Open the extractor