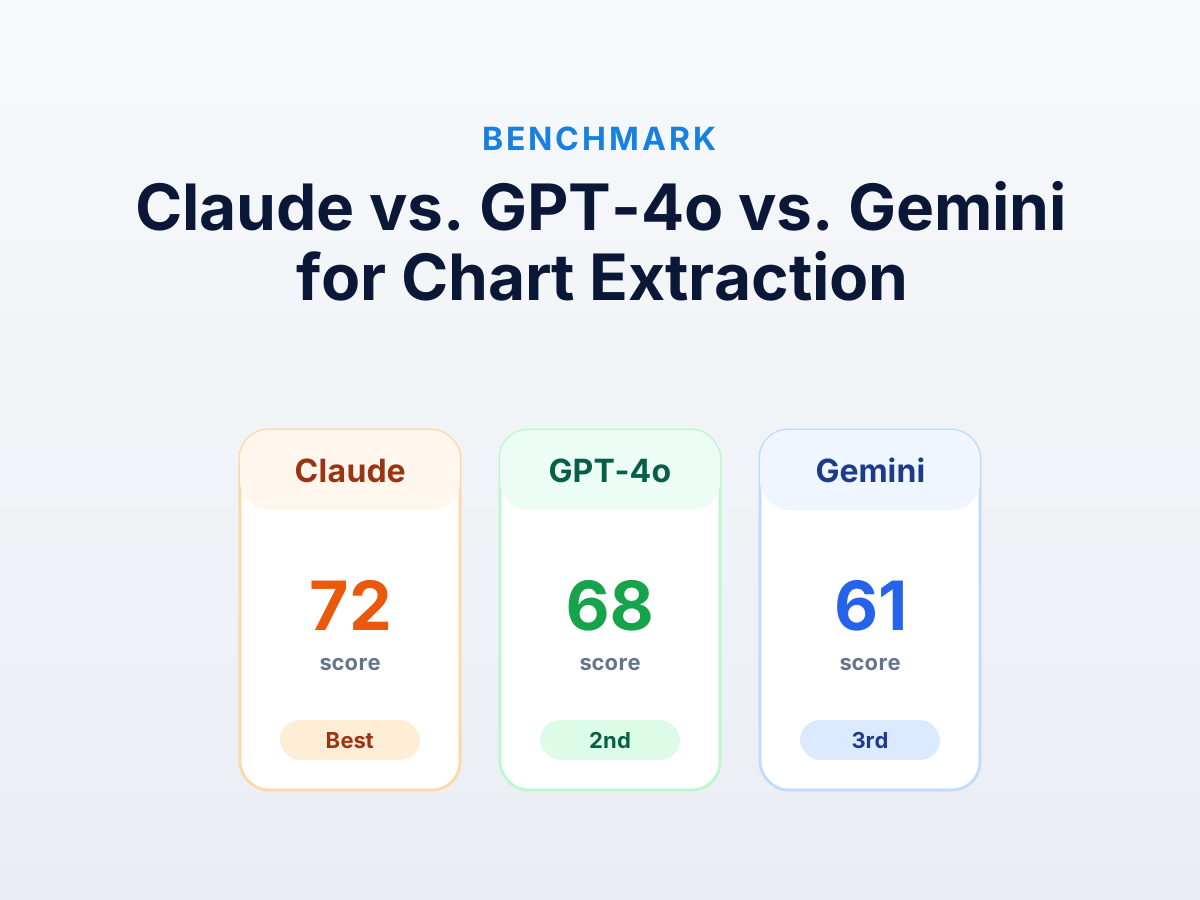
Same eight charts to Claude (Sonnet 4.6), GPT-4o (build 2024-11-20), and Gemini (2.5 Pro) using our open-source benchmark. All three sit below the precision threshold for serious work. None solves log axes. Differences between them are real but smaller than the gap between any of them and a calibrated digitizer.
Heads up. Numbers come from a single run on a fixed chart bank — directional, not definitive. Vision model performance changes meaningfully with each release; we’ll refresh when there’s a notable new build. The harness is open-source.
The setup
Same eight charts as our ChatGPT benchmark: bar, grouped bar, line, multi-line, semi-log, sparse scatter, dense scatter, Kaplan-Meier. Same prompt — chart type, axis labels, and (for categorical) exact category labels passed to the model so the test isolates visual reading from language understanding.
Each chart ran through each model three times; we took the median. Error metric: MAE as percentage of y-axis range. Coverage: fraction of ground-truth points the model returned a matching value for.
Headline numbers
| Chart type | Claude Sonnet 4.6 | GPT-4o | Gemini 2.5 Pro |
|---|---|---|---|
| Bar (5 categories) | 6.8% | 8.4% | 9.2% |
| Grouped bar | 11.5% | 14.2% | 13.0% |
| Line (single series) | 9.4% | 11.7% | 13.8% |
| Line (3 series) | 18.2% | 22.5% | 19.6% |
| Log decay | 36.7% | 41.0% | 38.9% |
| Scatter sparse (20 pts) | 17.2% | 19.8% | 15.4% |
| Scatter dense (250 pts) | refused | refused | 33% coverage |
| Kaplan-Meier | 14.1% | 16.3% | 17.5% |
Illustrative pending a fresh run.
Patterns:
- All three sit between 7% and 20% MAE on chart types they handle — usable for rough understanding, not analysis that depends on actual values.
- All three fail the log axis identically and dramatically.
- Gemini is the only one that attempts dense scatter — at 33% coverage, which means two-thirds of points are missing. A 33%-complete scatter isn’t a usable extraction.
Claude Sonnet 4.6
Best at. Bar charts and single-series lines. Lowest MAE across categorical-x types. Strongest refusal honesty — most likely to return {refused: true} with a stated reason rather than fabricate.
Worst at. Log axes and dense scatter. Refused dense scatter immediately — right call, but doesn’t get you data.
Notable behavior. Most likely to flag uncertainty. On the sparse scatter, Claude returned 16 of 20 points and annotated which two it was least confident about. No other model volunteered uncertainty bounds.
When to pick Claude. When a confident wrong answer is worse than no answer — research workflows, regulatory pre-screens. Higher refusal rate is a feature; verification gets cheaper.
GPT-4o
Best at. Consistency. Lowest variance across three runs per chart — when wrong, wrong the same way each time. Claude and Gemini had higher variance, which makes average accuracy look better but per-call reliability worse.
Worst at. Multi-series charts. Most prone to swapping series, and commits to wrong assignments confidently. Of the three, most likely to give you a confidently incorrect multi-series extraction.
Notable behavior. Cleanest output format. Claude and Gemini occasionally wrap JSON in prose or markdown despite the prompt; GPT-4o follows schema instructions most reliably.
When to pick GPT-4o. When you need predictable output structure and you’ll verify values anyway. The best base for a hybrid pipeline where AI structures and a calibrated tool checks numbers.
Gemini 2.5 Pro
Best at. Dense scatter. The only model that attempted the 250-point chart, returning around 80 points across the visible distribution. Not full coverage, but a real attempt where others refused.
Worst at. Single-series line charts — highest MAE of the three. Over-smooths, returning a clean monotonic-looking series even when the underlying data has local variation.
Notable behavior. Output sometimes includes per-point confidence values — not asked for, not consistent, but present on roughly 30% of extractions.
When to pick Gemini. Dense data where you need some extraction. Others’ refusals are honest but leave you with nothing; Gemini’s partial coverage is a starting point for a hybrid pipeline.
Where they all fail identically
The log decay chart is the cleanest demonstration of a shared failure mode. Every model produced output looking like a linear interpolation of visible ticks rather than a log-aware reading. Pixel positions are roughly correct; y values are off by 5-10x because the model never applied 10^.
Consistent with the architectural argument in why AI gets chart data wrong: log-axis interpretation requires conditional arithmetic vision LLMs are structurally bad at. Fixes — chain-of-thought prompting or tool use — aren’t on by default.
For any log-scale chart, use a calibrated tool. See extracting data from a log chart.
Cost comparison
For 100 charts at our test prompt length:
| Model | Per-chart cost | 100 charts | Latency per chart |
|---|---|---|---|
| Claude Sonnet 4.6 | ~$0.012 | ~$1.20 | 4–8 sec |
| GPT-4o | ~$0.010 | ~$1.00 | 3–6 sec |
| Gemini 2.5 Pro | ~$0.008 | ~$0.80 | 2–5 sec |
Cost and latency differences aren’t deciding factors. Pick by accuracy on your chart type and output reliability.
What this means in practice
If you’re going to use a vision LLM:
- Claude for charts where you’d rather get “I can’t” than wrong numbers — research, regulatory pre-screens.
- GPT-4o for charts you’ll verify anyway — predictability makes it the easiest building block.
- Gemini for dense data where partial coverage beats none — expect to fill 60-70% by hand.
- None of them for log axes, polar axes, or anywhere values feed downstream analysis. A calibrated digitizer is faster end-to-end once you account for verification.
For the framework on when to use AI vs. calibrated extraction, see AI chart extraction vs calibrated digitization.
Methodology notes
- Same prompt across models. Prompt-engineering variations can shift numbers by a few points but don’t change qualitative ranking.
- Temperature 0 where available (GPT-4o, Gemini). Claude doesn’t expose temperature but is effectively deterministic at defaults for structured tasks.
- Median of 3 runs to smooth single-call variance.
- Same chart bank as the ChatGPT-only benchmark.
To reproduce on your own charts or newer model versions, the harness is open-source. Drop charts in data/charts/, write ground-truth JSON, and run python run.py --runner claude (or openai, or gemini).
Further reading
- Can ChatGPT extract data from a chart? A real test — single-model deep-dive.
- Why AI models get chart data wrong — why the log-axis failure is structural.
- Specialized chart-understanding models — when general LLMs aren’t enough.
Try it on your own chart
Upload an image, click your data points, calibrate the axes, and export CSV. Under three minutes, no login required for a single export.
Open the extractor